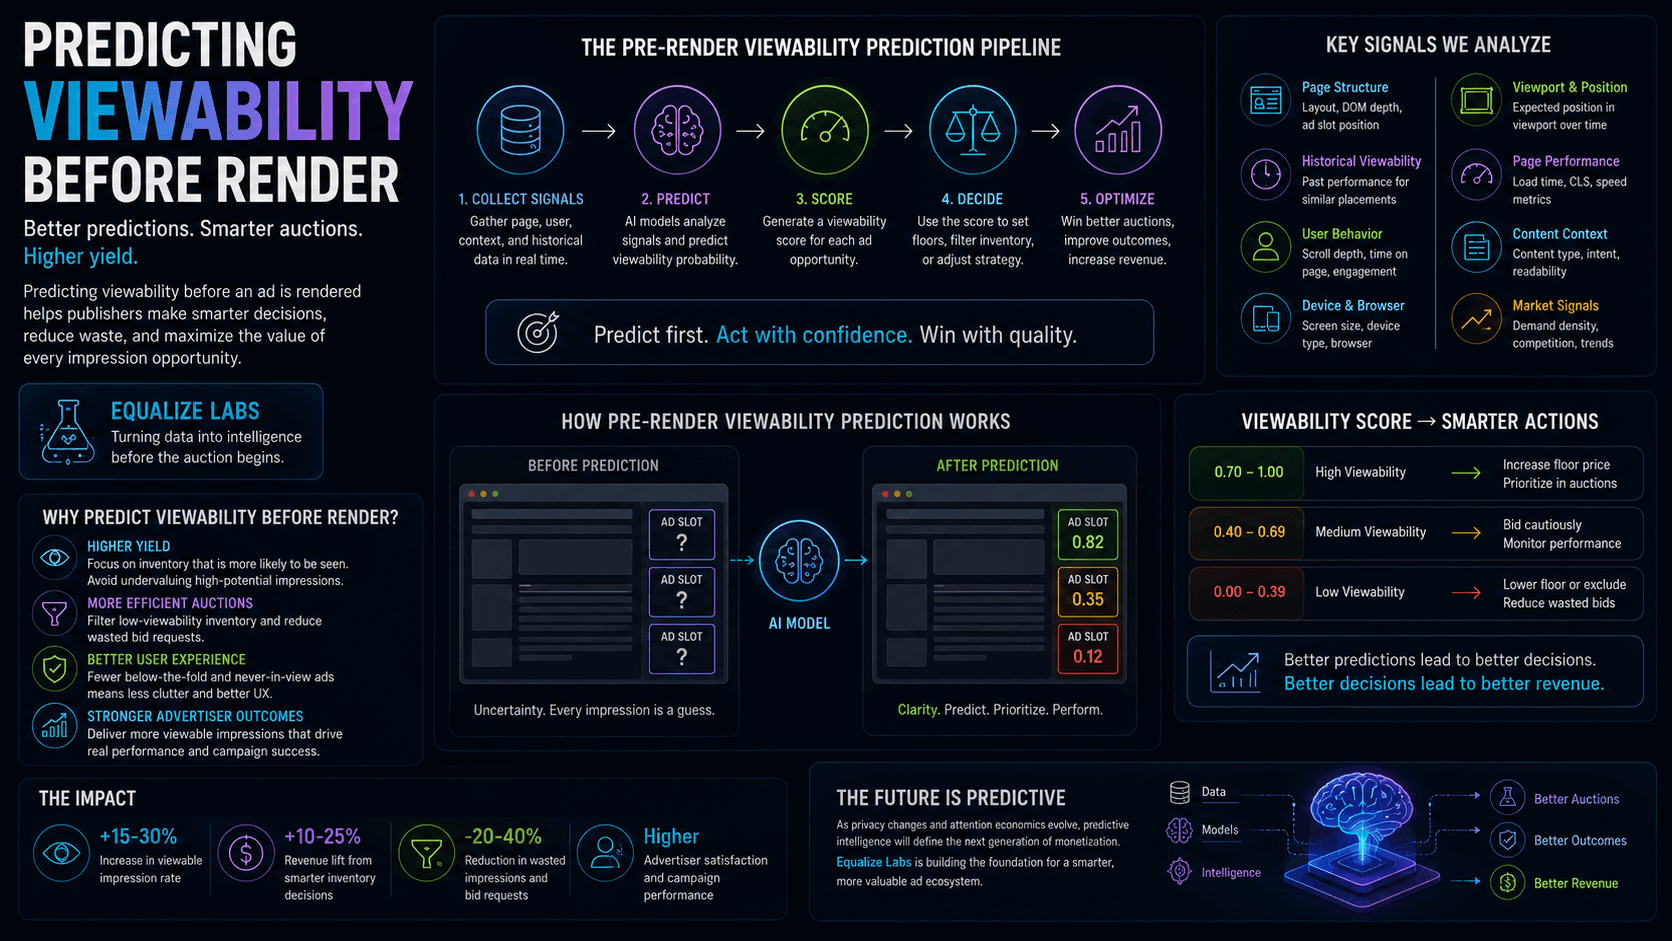
Most viewability measurement happens after an impression has already been delivered. The ad renders, the browser loads, and the user scrolls. Only then do publishers discover whether the impression was actually viewable.
By that point, the auction has already happened, pricing decisions have already been made, demand has already been routed, and revenue has already been won or lost. This raises an important question: what if viewability could be estimated before the ad ever renders?
At Equalize Labs, we explore monetization as a predictive system where behavior, auctions, and inventory quality can be modeled before decisions are made. Viewability prediction is one of the most practical examples of this approach because it shifts optimization from a reactive process to a proactive one.
Instead of measuring visibility after the fact, publishers can estimate the probability of viewability before an auction begins and use that information to optimize pricing, placement selection, and demand strategy.
Why Predict Viewability?
Viewability remains one of the most important signals in digital advertising. Advertisers consistently prefer inventory that is likely to be seen, and high-viewability placements often attract stronger demand, more competition, and better campaign performance.
The challenge is that traditional viewability measurement is inherently reactive. It answers a simple question:
Was this impression viewable?
Prediction answers a more valuable question:
How likely is this impression to be viewable before we serve it?
That distinction fundamentally changes how publishers can manage inventory. Rather than reacting to outcomes after delivery, they can make decisions based on expected outcomes before the auction even begins.
The Cost of Waiting for Measurement
Traditional viewability reporting creates a delayed feedback loop. A publisher launches inventory, performance data accumulates, patterns emerge, and adjustments are eventually made. Depending on traffic volume and reporting cadence, this process can take days or even weeks.
During that time, valuable opportunities may be underpriced while weaker opportunities continue consuming demand. Publishers are effectively making monetization decisions using historical information rather than current expectations.
Prediction reduces that delay. By estimating inventory quality before the auction begins, publishers gain the ability to make smarter decisions in real time and adapt monetization strategies before revenue opportunities are lost.
Viewability Is Not Random
One of the most important observations from viewability research is that visibility is surprisingly predictable. Many of the factors that influence viewability are already known before an impression is created.
Examples include:
- Placement position
- Layout structure
- Device type
- Screen dimensions
- Viewport size
- Historical performance
- Content length
- Scroll behavior patterns
- User engagement signals
When combined, these inputs often reveal whether a placement is likely to be viewed long before the browser reports the final result. As a result, viewability prediction becomes a practical modeling problem rather than an impossible forecasting challenge.
Signals Used in Prediction Models
A predictive viewability system evaluates multiple categories of signals simultaneously. Each category contributes a different perspective on the likelihood that an impression will ultimately be seen.
Layout Signals
Page structure frequently influences visibility outcomes because it determines where inventory appears relative to content and user attention.
Useful signals include:
- Placement depth
- DOM position
- Relative content location
- Container size
- Expected viewport exposure
Layout signals often provide some of the strongest predictive power because they remain relatively stable across impressions and directly influence whether an ad enters the user's field of view.
Behavioral Signals
Users interact with content differently, and those interactions can significantly affect viewability outcomes.
Behavioral signals may include:
- Scroll velocity
- Reading pace
- Session depth
- Engagement level
- Historical interaction patterns
These signals help estimate how users are likely to consume content and whether inventory is likely to enter view during the session.
Device Signals
Device characteristics can dramatically influence visibility because screen size, browser behavior, and viewport constraints vary across environments.
Examples include:
- Screen resolution
- Viewport dimensions
- Device category
- Orientation
- Browser environment
A placement that performs exceptionally well on desktop may behave very differently on mobile devices, making device-level context an important component of prediction models.
Historical Performance
Past outcomes often reveal useful patterns that can improve future predictions.
Examples include:
- Historical viewability rates
- Attention performance
- In-view time
- Auction outcomes
- Engagement metrics
Historical data provides a foundation for future predictions by identifying recurring trends and performance characteristics across placements and audiences.
Designing the Experiment
At Equalize Labs, predictive viewability experiments follow the same methodology used throughout our research framework.
Goal
The primary objective is to determine whether pre-render viewability prediction improves monetization decisions and creates measurable business value.
Inputs
The model evaluates signals that are available before the auction begins, including:
- Layout characteristics
- Device information
- Behavioral signals
- Historical placement performance
Outputs
Predictions are compared against measured outcomes after delivery, including:
- Actual viewability
- In-view time
- Attention performance
- Revenue
- Auction competition
Evaluation Window
Predictions must be compared against actual outcomes across a meaningful volume of impressions to determine whether the model provides actionable insights.
The objective is not perfect prediction. The objective is better decision-making. Even modest improvements in forecasting accuracy can create meaningful gains when applied across large volumes of inventory.
What Prediction Enables
Predicting viewability becomes valuable when it influences action. The real benefit comes from using predictions to improve monetization decisions before impressions reach the market.
Smarter Floor Pricing
Inventory with a high probability of viewability may justify more aggressive floor strategies. By identifying valuable opportunities in advance, publishers can better protect premium inventory before it enters the auction.
Better Placement Selection
Prediction helps identify which placements deserve inventory allocation and which opportunities should be deprioritized. This allows publishers to focus resources on placements that are more likely to generate value.
Improved Auction Efficiency
Low-probability opportunities can be filtered, delayed, or treated differently within the monetization stack. This reduces wasted auctions, improves demand quality, and helps buyers compete for inventory that is more likely to perform.
Stronger Revenue Outcomes
When pricing and auction decisions reflect expected inventory quality, monetization becomes more efficient. Revenue becomes a function of predicted value rather than historical averages alone.
Beyond Viewability: The Path to Attention Prediction
Viewability prediction is only the first step. The same framework can be extended toward more sophisticated outcomes that provide deeper insight into inventory quality and user engagement.
Examples include:
- Attention prediction
- Engagement prediction
- Demand forecasting
- Auction outcome prediction
- Revenue forecasting
Each additional layer moves publishers further away from reactive measurement and closer to predictive decision-making. The long-term goal is not simply knowing what happened, but understanding what is likely to happen next and acting on that information before opportunities are lost.
From Measurement to Decision Systems
The advertising industry has spent years measuring inventory quality. The next phase is using those measurements to drive decisions.
Prediction transforms analytics from a reporting function into an optimization function. Instead of learning after an auction completes, publishers can act before it begins. This represents a fundamental shift in how monetization systems operate.
Inventory quality becomes something that can be estimated, valued, and protected in advance. As predictive systems improve, publishers gain greater control over pricing, allocation, and demand strategy, allowing them to optimize outcomes before impressions are ever served.
Conclusion
Viewability is one of the most important signals in digital advertising, but measuring it after delivery limits its usefulness. By combining layout, behavioral, device, and historical performance signals, publishers can estimate viewability probability before an ad renders and before an auction begins.
The result is smarter pricing, stronger inventory valuation, better auction efficiency, and more informed monetization decisions. At Equalize Labs, we view predictive viewability as part of a larger transition from measurement systems to decision systems.
The future of monetization belongs not to publishers who react fastest, but to publishers who can predict value before it appears.